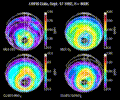
 MLS ClO,O3,HNO3, col. O3 17
Sep 1992
MLS ClO and O3 and CLAES HNO3 and ClONO2 at 460K
on Sep. 17, 1992 in the Southern Hemisphere.
|
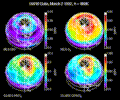 MLS ClO,O3,HNO3, col. O3
2 Mar 1992
MLS ClO and O3 and CLAES HNO3 and ClONO2 at 480K
on Mar. 2, 1992 in the Northern Hemisphere.
|
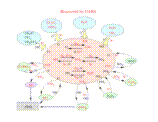
UARS_const_chemistry
Cartoon of constituents important in ozone
chemistry - those measured by UARS are given in red. Adapted from
Figure 1 of Russell et al., JGR, 98, 10777-10797, 1993.
|
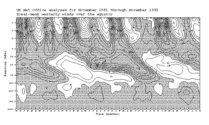
UKMO_qbo_sao_
Time series of westerly winds over the equator from the UK Met Office correlative analyses, for the period November 1991 through February
1996. The plot shows a clear quasi-biennial oscillation in the stratospheric winds and a semi-annual oscillation near the stratopause.
|
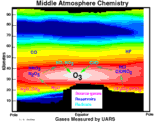
Middle atmosphere chemistry
Cartoon of constituents measured by UARS plotted on top of a HALOE O3 zonal mean view, which was slightly altered for a better viewgraph
|
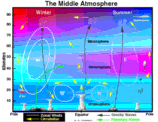
Middle atmosphere dynamics
Cartoon of winds and waves in the atmosphere from the ground to 100 km for a solstice condition.
|