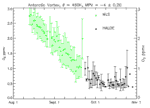
 Timeseries O3 SH
MLS and HALOE O3 in the Antarctic Vortex at 480K from Aug. 1 to Nov. 1, 1993.
|
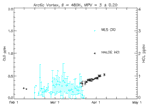 Timeseries ClO NH
HALOE HCl and MLS ClO in the Arctic Vortex at 480K from Feb. 1 to May 1, 1994.
|
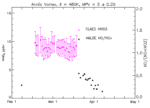
Timeseries HNO3 NH
CLAES HNO3 and HALOE NO/NOx in the Arctic Vortex at 480K from Feb. 1 to May 1, 1994.
|
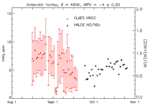
Timeseries HNO3 SH
CLAES HNO3 and HALOE NO/NOx in the Antarctic Vortex at 480K from Aug. 1 to Nov. 1, 1993.
|
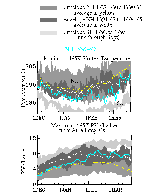
Interannual_T_pvgrad_465K
Shows interannual variability in 465 K minimum temperatures and maximum pv gradients, using 18 years of NMC data
(an update of Figure 1 in the Zurek et al. 1996 GRL paper).
|
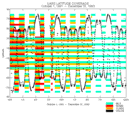
uars_coverage_color_p
Latitude coverage of MLS, ISAMS, CLAES, and HALOE for the period Oct. 1, 1991 to Dec. 31, 1993.
|