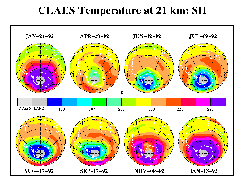
CLAES_TEMP_S8
Polar orthographic projections of 24 hours of temperature data at 21 km as measured by CLAES in the Antarctic stratosphere for individual days between January
1992 and January 1993. These days emphasize the southern winter vortex region and the decreased temperature therein. [Similar to figures and discussion in
"Observations of Lower-Stratospheric ClONO2, HNO3, and Aerosol by the UARS CLAES Experiment between January 1992 and April 1993", by Roche et al.,
J. Atmos. Sci., 51, 2877-2902, Oct. 15, 1994.] |

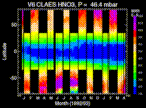
HNO3_46
CLAES HNO3 measurement at 46.4 mbar over length of CLAES observing period.
|

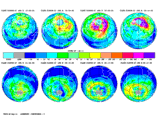
clono2_nsCLAES ClONO2 at 465 K on Oct. 25, 1992, Dec. 3, 1992, Feb. 22, 1993, and Mar. 14, 1993 in the Northern Hemisphere and on Apr. 28, 1993, Jun. 12,
1993, Aug. 17, 1993, and Sep. 17, 1993 in the Southern Hemisphere.
|

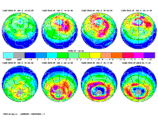
CLAES HNO3 NS
CLAES HNO3 at 465 K on Oct. 25, 1992, Dec. 3, 1992, Feb. 22, 1993, and Mar. 14, 1993 in the Northern Hemisphere and on Apr. 28, 1993, Jun. 12, 1993,
Aug. 17, 1993, and Sep. 17, 1993 in the Southern Hemisphere.
|
|
|