 |
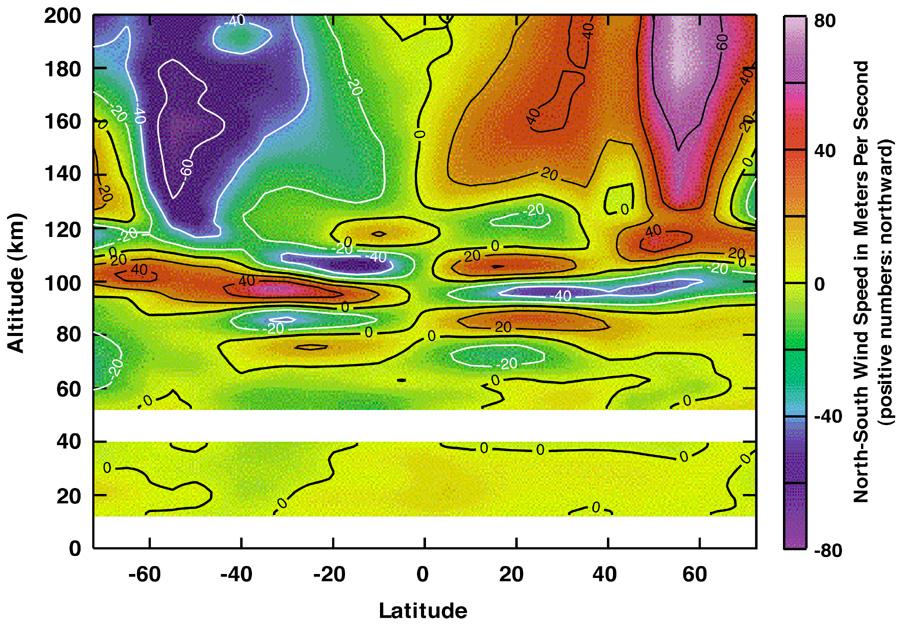
Tidal amplitudes increase with altitude as air density decreases. This is seen in the composite image aof atmospheric tidal measurements made by HRDI and WINDII for February 1993 to April 1994. The meridional (N-S) tidal wind is shown as a function of altitude and latitude at 12:00 non, local time. Near 100 km tides can break creating turbulent regions. UARS observations are the most extensive global measurements of atmospheric tidal winds ever produced.
|
|
Last modified: March 08, 2017