This web page's content and links are no longer actively maintained. It is available for reference purposes only. NASA Official: Luke Oman
 

Development of the Antarctic Ozone Hole

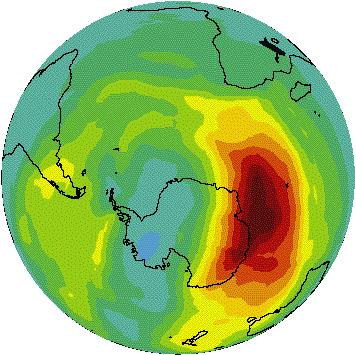
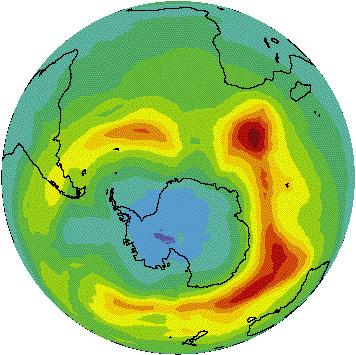
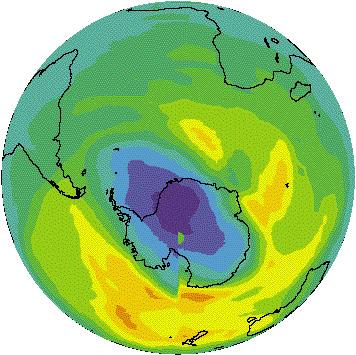
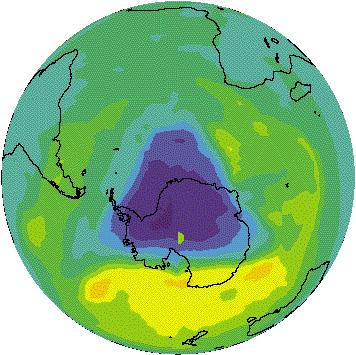
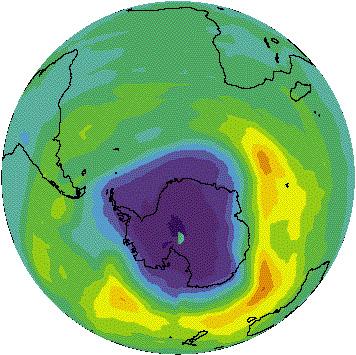
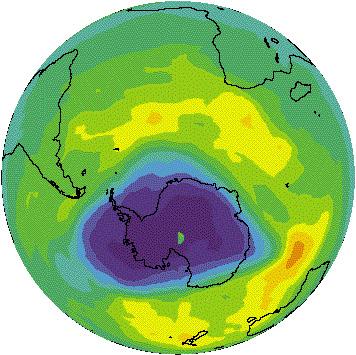
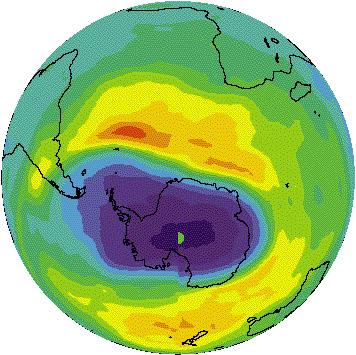
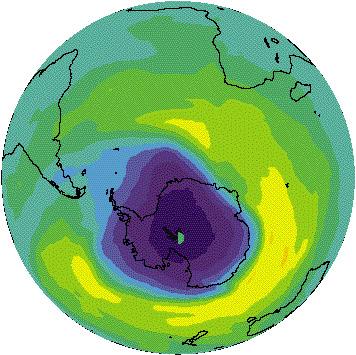
October 5 ozone column images for every other year since 1979 showing the growth of the Antarctic ozone hole. Blue and purple indicates areas of low ozone; red indicates areas of more ozone. Early October is the time of the maximum ozone depletion in the stratosphere over the Antarctic.

1979

Ozone Column Image - 1979

1981

Ozone Column image - 1981

1983

Ozone Column Image - 1983

1985

Ozone Column Image - 1985

1987

Ozone Column Image - 1987

1989

Ozone Column Image - 1989

1991

Ozone Column Image - 1991

1993

Ozone Column image - 1993

Ozone Scale

Scale for Above Data


BACK ARROW    Go back to Brochure Page.    SAT PICTURE   UARS Home Page  
Web Curator: Monica Todirita, (Science Systems Applications, Inc) (todirita@umpgal.gsfc.nasa.gov)
Responsible NASA organization/official: Dr. Luke Oman, Atmospheric Chemistry and Dynamics Laboratory

Last modified: March 08, 2017