 |
Ionization Map
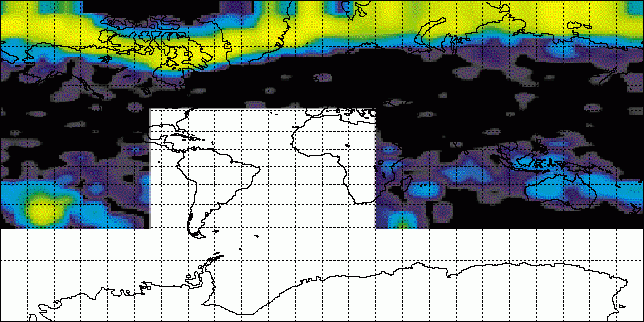
The atmospheric ionization rate measured by PEM near the peak of solar cycle 22. The ionization is caused by fast downward-moving electrons from the magnetosphere impacting air molecules. Green and yellow represent larger amounts of ionization; blue and black represent smaller amounts of ionization.
 |
Solar Cycle Variations in Ion Production
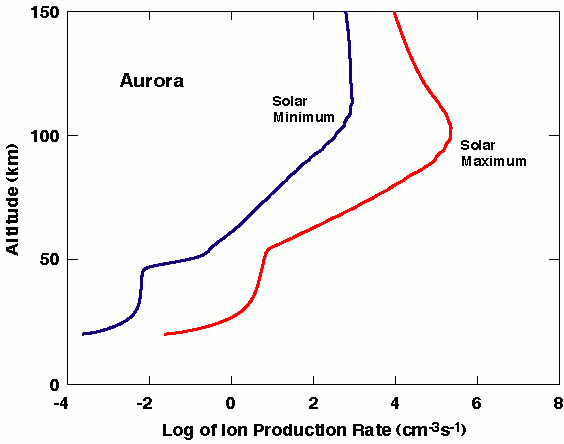
The change in ion production rate from energetic particles as measured by PEM over an 11-year solar cycle. Fast downward-moving electrons from the magnetosphere create ions. The ion production rate varies by a factor of 50 to 200 near solar minimum (blue line) to near solar maximum (red line). The high-energy electrons can cause ozone decreases in the polar mesosphere by producing nitrogen and hydrogen radicals.

Last modified: March 08, 2017