Satellite measurements show that ozone amounts vary with altitude and latitude. The colors indicate the ozone mixing ratio (the ratio of ozone molecules to air molecules in parts per million by volume (ppmv)). The ozone layer, light blue to red, is between ~12-50 km at all latitudes. The peak concentration of ozone in the stratosphere rarely exceeds 12 ozone molecules per million air molecules.
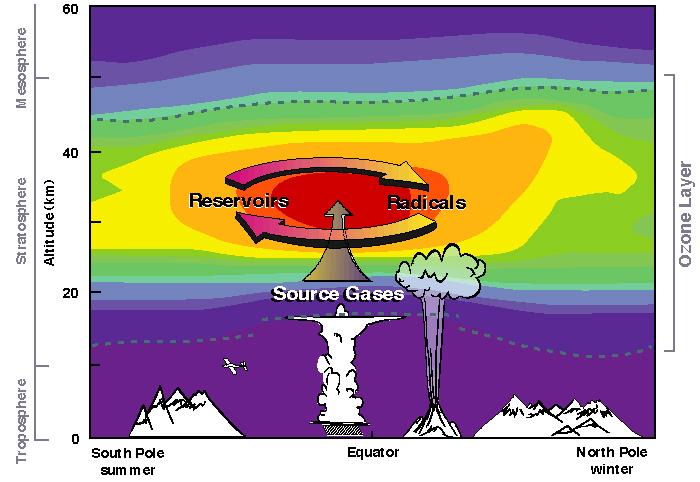
The arrows indicate that source gases that rise from the troposphere into the stratosphere eventually form radicals. Radicals can destroy ozone or can react with each other to form reservoir gases that do not destroy ozone.
Stratospheric chemical reactions can be accelerated by the presence of polar stratospheric clouds and sulfate aerosols. Stratospheric sulfate aerosols come from sulfur compounds and volcanic injection of sulfur dioxide (SO2).
Last modified: March 08, 2017