This web page's content and links are no longer actively maintained. It is available for reference purposes only. NASA Official: Luke Oman
 

Ozone Hole Mapping Continues with UARS Instruments

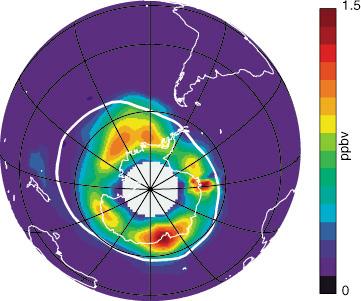
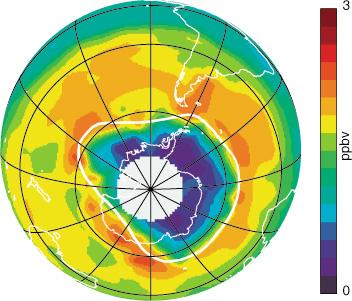
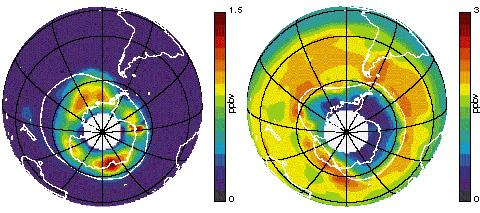
UARS has made ozone hole measurements since the satellite was deployed in 1991. As with previous years, the 1997 MLS data show high levels of ClO over the South Pole. Exposure of the ozone layer to high levels of ClO produced subsequent ozone loss just over a month later. The white line shows the edge of the polar vortex. Since 1995, the size of the Antarctic ozone hole has stabalized to roughly 24 million square kilometers in area.

MLS CIO and Ozone Maps

CIO measurement-Aug 1997

ClO, August 27, 1997

Ozone Map-Oct 1997

Ozone, October 10, 1997


BACK ARROW    Go back to Brochure Page.    SAT PICTURE   UARS Home Page  
Web Curator: Monica Todirita, (Science Systems Applications, Inc) (todirita@umpgal.gsfc.nasa.gov)
Responsible NASA organization/official: Dr. Luke Oman, Atmospheric Chemistry and Dynamics Laboratory

Last modified: March 08, 2017