 |
 |
|
|
|
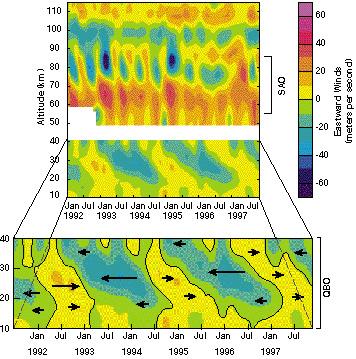
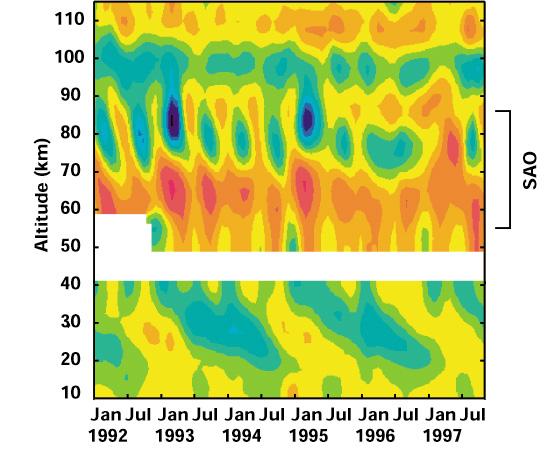
Equatorial Winds
HRDI has made measurements of the averaged east-west tropical winds in the stratosphere and mesosphere from 1992 to 1998. The lower figure shows the QBO from 20-40 km as descending westward (green to blue) and eastward (red to yellow) winds. In the lower mesosphere (60-80 km) the wind structure is dominated by the semiannual oscillation (SAO), a twice-yearly reversal in the winds.
|
|
|
|
|
|
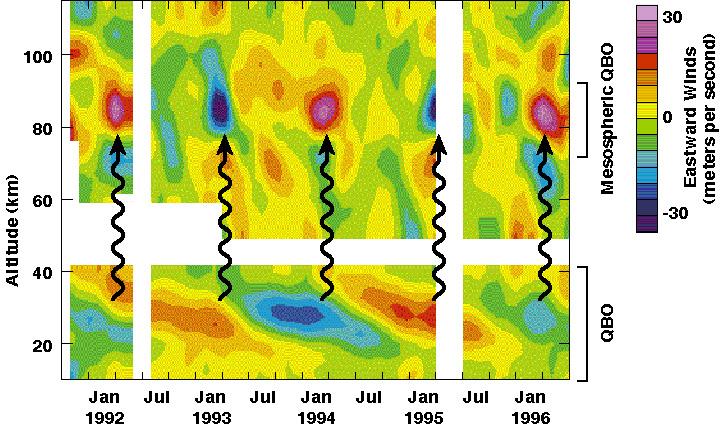
Equatorial Winds with AO and SAO Removed
Removing the SAO and the annual oscillation (AO) (upper figure) shows that the influence of the QBO extends into the mesosphere (80 km). Mesospheric wind changes occur coincident with the change of the QBO winds near 30 km. This coupling between the mesosphere and the stratosphere is believed to be caused by small-scale upward moving atmospheric waves, as indicated by wiggly arrows.
 |
Last modified: March 08, 2017