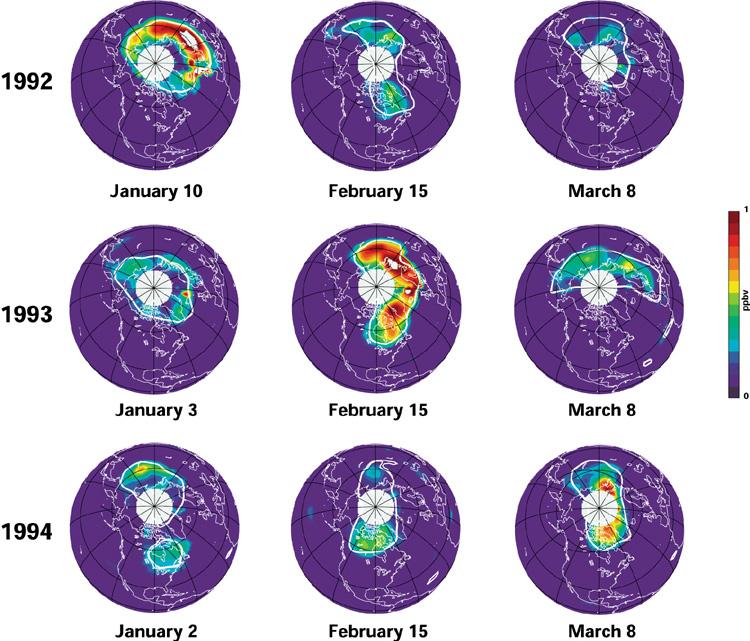
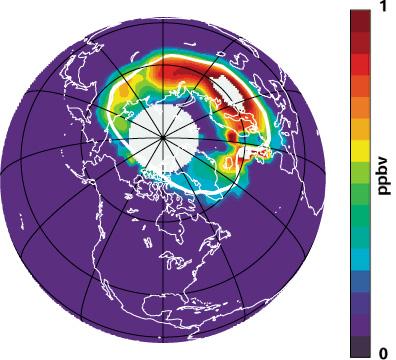
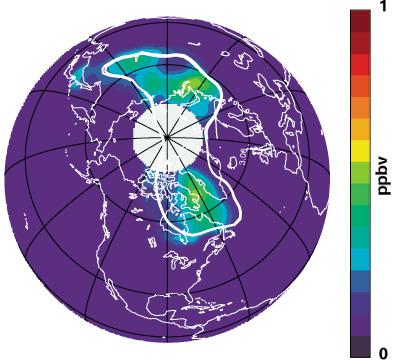
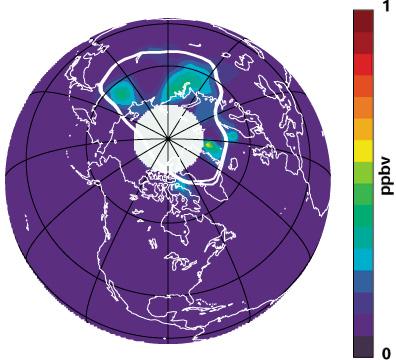
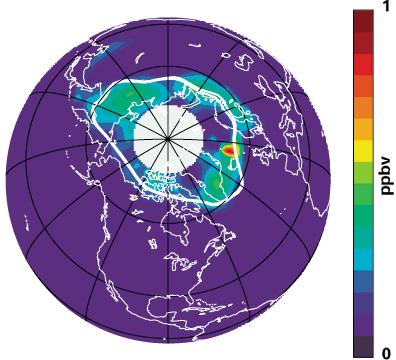
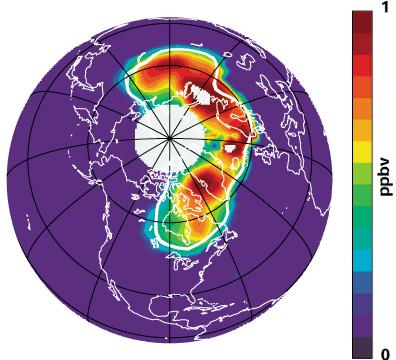
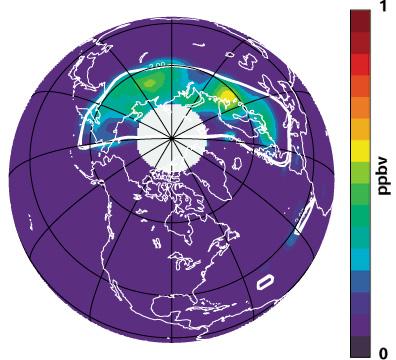
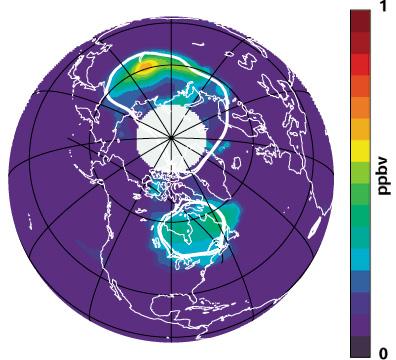
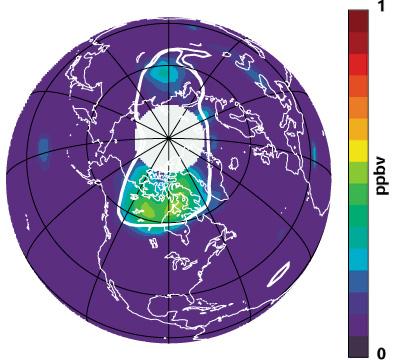
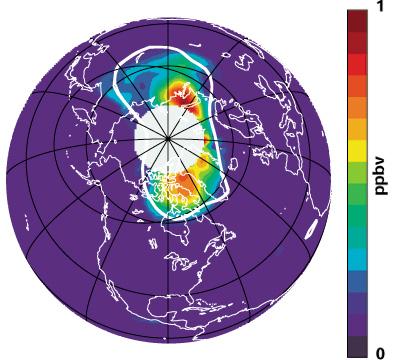
Each winter the ozone-destroying radical ClO increases in the north polar region when polar stratospheric clouds form in the cold stratosphere. The ClO concentration then decreases as the temperature rises in the spring. Thick white lines indicate the polar vortex boundary estimated from meteorlogical data. Red areas inside these white lines are regions of high ClO. Because each year the stratospheric weather is different, the timing of the ClO buildup and decay is different. These 3 years of MLS data illustrate this variability. In contrast to the Arctic, Antarctic ClO buildup does not vary much from year to year because the Antarctic vortex is stronger and Antarctic stratospheric temperatures are much colder.
January 10, 1992 |
February 15, 1992 |
March 8, 1992 |
|
January 3, 1993 |
February 15, 1993 |
March 8, 1993 |
|
January 2, 1994 |
Febraury 15, 1994 |
March 8, 1994 |
Last modified: March 08, 2017